
Early-season ski from work
Yesterday a co-worker and I were talking about how we weren’t able to enjoy the new snow because the weather had turned cold as soon as the snow stopped falling. Along the way, she mentioned that it seemed to her that the really cold winter weather was coming later and later each year. She mentioned years past when it was bitter cold by Halloween.
The first question to ask before trying to determine if there has been a change in the date of the first cold snap is what qualifies as “cold.” My officemate said that she and her friends had a contest to guess the first date when the temperature didn’t rise above -20°F. So I started there, looking for the month and day of the winter when the maximum daily temperature was below -20°F.
I’m using the GHCN-Daily dataset from NCDC, which includes daily minimum and maximum temperatures, along with other variables collected at each station in the database.
When I brought in the data for the Fairbanks Airport, which has data available from 1948 to the present, there was absolutely no relationship between the first -20°F or colder daily maximum and year.
However, when I changed the definition of “cold” to the first date when the daily minimum temperature is below -40, I got a weak (but not statistically significant) positive trend between date and year.
The SQL query looks like this:
SELECT year, water_year, water_doy, mmdd, temp
FROM (
    SELECT year, water_year, water_doy, mmdd, temp,
        row_number() OVER (PARTITION BY water_year ORDER BY water_doy) AS rank
    FROM (
        SELECT extract(year from dte) AS year,
            extract(year from dte + interval '92 days') AS water_year,
            extract(doy from dte + interval '92 days') AS water_doy,
            to_char(dte, 'mm-dd') AS mmdd,
            sum(CASE WHEN variable = 'TMIN'
                     THEN raw_value * raw_multiplier
                     ELSE NULL END
               ) AS temp
        FROM ghcnd_obs
            INNER JOIN ghcnd_variables USING(variable)
        WHERE station_id = 'USW00026411'
        GROUP BY extract(year from dte),
            extract(year from dte + interval '92 days'),
            extract(doy from dte + interval '92 days'),
            to_char(dte, 'mm-dd')
        ORDER BY water_year, water_doy
    ) AS foo
    WHERE temp < -40 AND temp > -80
) AS bar
WHERE rank = 1
ORDER BY water_year;
I used “water year” instead of the actual year because the winter is split between two years. The water year starts on October 1st (we’re in the 2013 water year right now, for example), which converts a split winter (winter of 2012/2013) into a single year (2013, in this case). To get the water year, you add 92 days (the sum of the days in October, November and December) to the date and use that as the year.
Here’s what it looks like (click on the image to view a PDF version):
The dots are the observed date of first -40° daily minimum temperature for each water year, and the blue line shows a linear regression model fitted to the data (with 95% confidence intervals in grey). Despite the scatter, you can see a slightly positive slope, which would indicate that colder temperatures in Fairbanks are coming later now, than they were in the past.
As mentioned, however, our eyes often deceive us, so we need to look at the regression model to see if the visible relationship is significant. Here’s the R lm results:
Call:
lm(formula = water_doy ~ water_year, data = first_cold)

Residuals:
    Min      1Q  Median      3Q     Max
-45.264 -15.147  -1.409  13.387  70.282

Coefficients:
             Estimate Std. Error t value Pr(>|t|)
(Intercept) -365.3713   330.4598  -1.106    0.274
water_year     0.2270     0.1669   1.360    0.180

Residual standard error: 23.7 on 54 degrees of freedom
Multiple R-squared: 0.0331,     Adjusted R-squared: 0.01519
F-statistic: 1.848 on 1 and 54 DF,  p-value: 0.1796
The first thing to check in the model summary is the p-value for the entire model on the last line of the results. It’s only 0.1796, which means that there’s an 18% chance of getting these results simply by chance. Typically, we’d like this to be below 5% before we’d consider the model to be valid.
You’ll also notice that the coefficient of the independent variable (water_year) is positive (0.2270), which means the model predicts that the earliest cold snap is 0.2 days later every year, but that this value is not significantly different from zero (a p-value of 0.180).
Still, this seems like a relationship worth watching and investigating further. It might be interesting to look at other definitions of “cold,” such as requiring three (or more) consecutive days of -40° temperatures before including that period as the earliest cold snap. I have a sense that this might reduce the year to year variation in the date seen with the definition used here.
After writing my last blog post I decided I really should update the code so I can control the temperature thresholds without having to rebuild and upload the code to the Arduino. That isn’t a big issue when I have easy access to the board and a suitable computer nearby, but doing this over the network is dangerous because I could brick the board and wouldn’t be able to disconnect the power or press the reset button. Also, the default position of the transistor is off, which means that bad code loaded onto the Arduino shuts off the fan.
But I will have a serial port connection through the USB port on the server (which is how I will monitor the status of the setup), and I can send commands at the same time I’m receiving data. Updating the code to handle simple one-character messages is pretty easy.
First, I needed to add a pair of variables to store the thresholds, and initialize them to their defaults. I also replaced the hard-coded values in the temperature difference comparison section of the program with these variables.
int temp_diff_full = 6;
int temp_diff_half = 2;
Then, inside the main loop, I added this:
// Check for inputs
while (Serial.available()) {
    int ser = Serial.read();
    switch (ser) {
        case 70: // F
            temp_diff_full = temp_diff_full + 1;
            Serial.print("full speed = ");
            Serial.println(temp_diff_full);
            break;
        case 102: // f
            temp_diff_full = temp_diff_full - 1;
            Serial.print("full speed = ");
            Serial.println(temp_diff_full);
            break;
        case 72: // H
            temp_diff_half = temp_diff_half + 1;
            Serial.print("half speed = ");
            Serial.println(temp_diff_half);
            break;
        case 104: // h
            temp_diff_half = temp_diff_half - 1;
            Serial.print("half speed = ");
            Serial.println(temp_diff_half);
            break;
        case 100: // d
            temp_diff_full = 6;
            temp_diff_half = 2;
            Serial.print("full speed = ");
            Serial.println(temp_diff_full);
            Serial.print("half speed = ");
            Serial.println(temp_diff_half);
            break;
    }
}
This checks to see if there’s any data in the serial buffer, and if there is, it reads it one character at a time. Raising and lowering the full speed threshold by one degree can be done by sending F to raise and f to lower; the half speed thresholds are changed with H and h, and sending d will return the values back to 6 and 2.
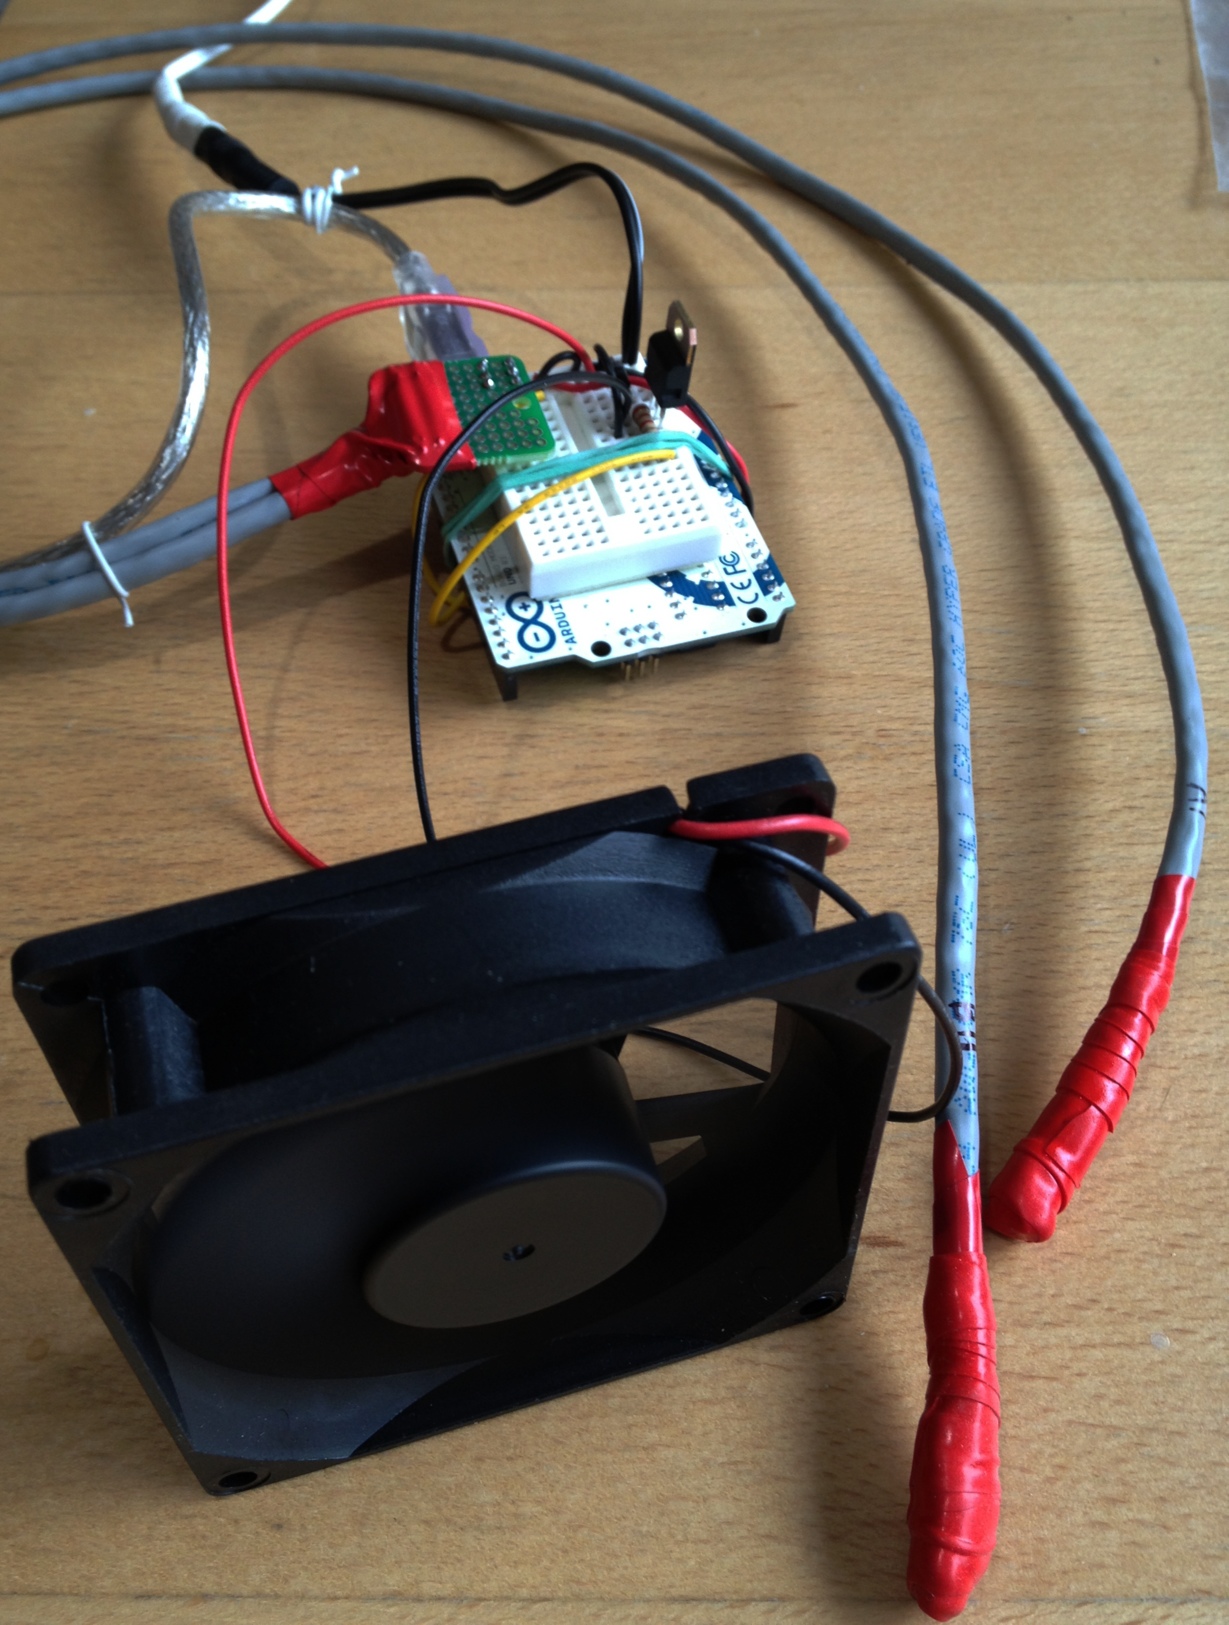
One of our servers at work has a power supply that is cooled with two small, loud fans—loud enough that the noise is annoying for the occupants of the office suite shared by the server. What I’d like to do is muffle the sound by enclosing the rear of the server (or potentially just the power supply exhaust) with an actively vented box. Since the fan on the box will be larger, it should be able to move the same amount of air with less noise.
But messing around with the way servers cool themselves is tricky, and since the server isn’t easily accessible, I’d like to be able to monitor what’s going on until I confirm my setup is able to keep the server cool.
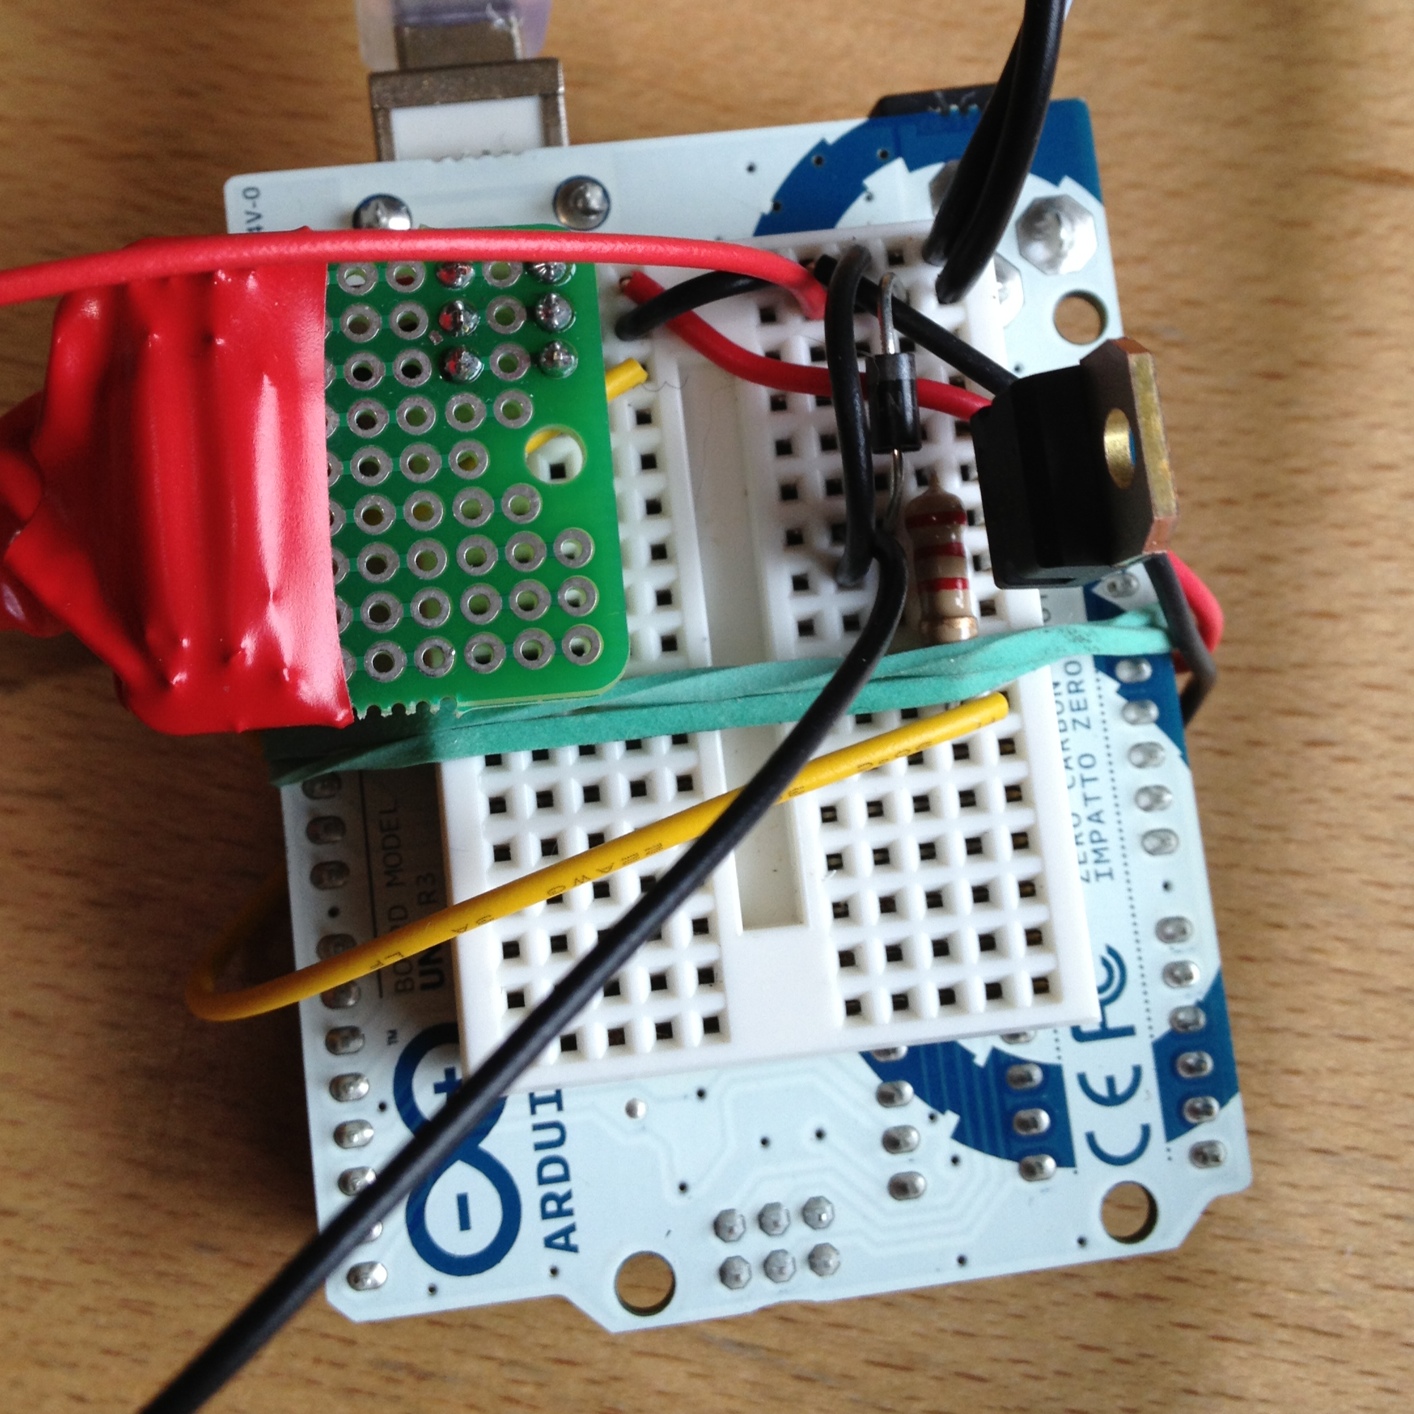
I’ve built quite a few temperature monitoring circuits, but in this project I’ll need to be able to control the speed of the vent fan based on the temperature differential inside and outside the box. This is complicated because the Arduino runs on 5 volts and the fan I’m starting with requires 12 volts. I’ll use a Darlington transistor, which can be triggered using the low power available from an Arduino pin, but which can carry the voltage and current of the fan. For higher voltages and currents, or for controlling devices that run on alternating current, I’d need to use some form of relay.
To measure the temperature differential between the inside and outside of the enclosure, I’m using two DS18B20 temperature sensors, each wired to the end of a length of Cat5e cable (and wrapped in silicone “Rescue Tape” as an experiment). The transistor is a TIP120, and a 1N4001 diode across the positive and negative leads of the fan protect it from reverse voltages when the fan is turned off but is still spinning. A 2.2KΩ resistor protects the trigger pin on the Arduino.
Here’s the diagram:
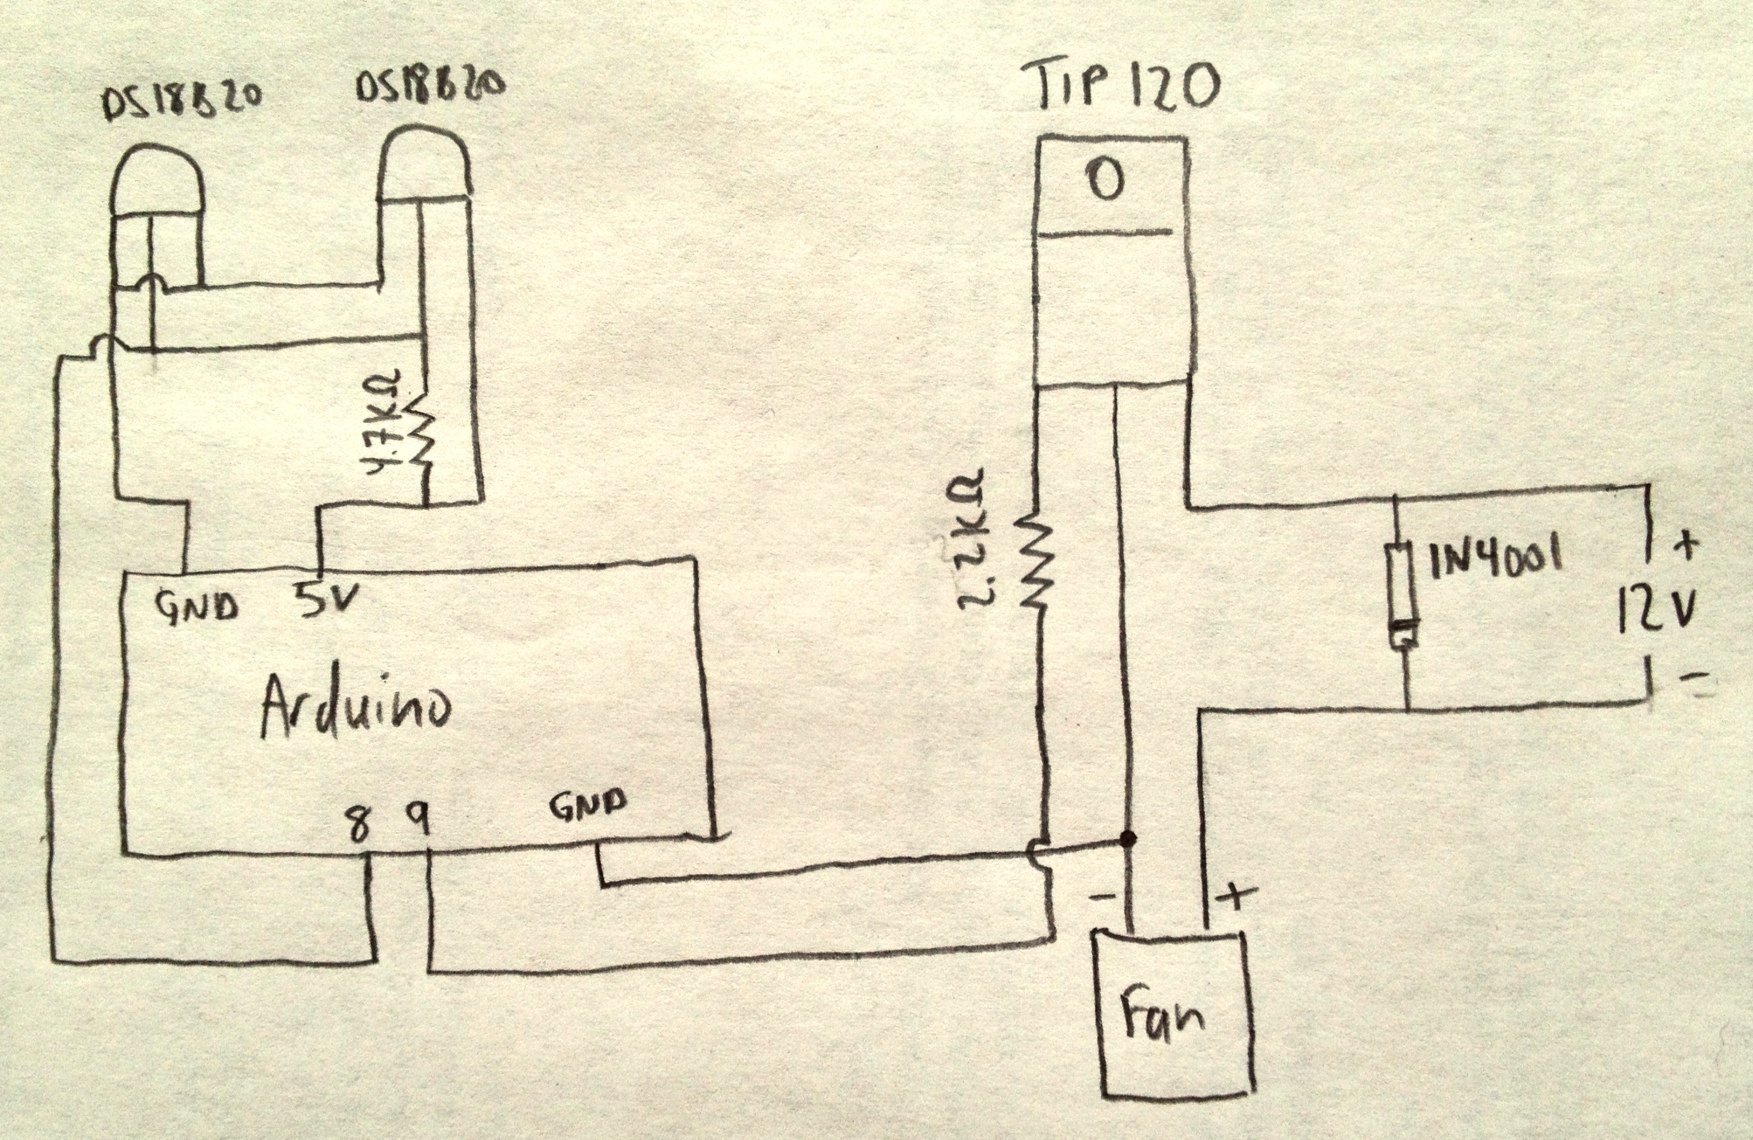
The Arduino is currently programmed to turn the fan on full speed when the temperature from the sensor inside the box is more than six degrees higher than the temperature outside the box. The fan runs at half speed until there’s less than a two degree differential, at which point the fan shuts off. These targets are hard-coded in the software, but it wouldn’t be too difficult to change the code to read from the serial buffer so that the thresholds could be changed while it’s running.
Here’s the setup code:
#include <OneWire.h>
#include <DallasTemperature.h>

#define ONE_WIRE_BUS 8
#define TEMPERATURE_PRECISION 12

#define fanPin 9

OneWire oneWire(ONE_WIRE_BUS);
DallasTemperature sensors(&oneWire);

DeviceAddress thermOne = { 0x28,0x7A,0xBA,0x0A,0x02,0x00,0x00,0xD1 };
DeviceAddress thermTwo = { 0x28,0x8B,0xFD,0x0A,0x02,0x00,0x00,0x96 };

void setup() {
    Serial.begin(9600);
    pinMode(fanPin, OUTPUT);
    digitalWrite(fanPin, LOW);

    sensors.begin();

    sensors.setResolution(thermOne, TEMPERATURE_PRECISION);
    sensors.setResolution(thermTwo, TEMPERATURE_PRECISION);
}

void printTemperature(DeviceAddress deviceAddress) {
    float tempC = sensors.getTempC(deviceAddress);
    Serial.print(DallasTemperature::toFahrenheit(tempC));
}
And the loop that does the real work:
void loop() {
    sensors.requestTemperatures();
    printTemperature(thermOne);
    Serial.print(",");
    printTemperature(thermTwo);
    Serial.print(",");
    float thermOneF = DallasTemperature::toFahrenheit(sensors.getTempC(thermOne));
    float thermTwoF = DallasTemperature::toFahrenheit(sensors.getTempC(thermTwo));
    float diff = thermOneF - thermTwoF;
    Serial.print(diff);
    Serial.print(",");
    if ((diff) > 6.0) {
        Serial.println("high");
        digitalWrite(fanPin, HIGH);
    } else if (diff > 2.0) {
        Serial.println("med");
        analogWrite(fanPin, 127);
    } else {
        Serial.println("off");
        digitalWrite(fanPin, LOW);
    }
    delay(10000);
}
When I’m turning the fan off or on, I’m using digitalWrite, but when running the fan at half-speed, because I’m using a pulse-width-modulation (PWM) digital pin, I can set the pin to a value between 0 (off all the time) and 255 (on all the time) and cause the fan to run at whatever speed I want. I’m also dumping the temperatures and fan speed setting to the serial port so I can read those values later and evaluate how well the setup is working.

Prototype temperature sensor
Last week I got permission to install a simple weather station where I work at ABR. The Fairbanks office is located on Goldstream Road, just past the intersection of Murphy Dome Road, across the street from the Peat Ponds. It’s on the uphill side of a south facing slope, and is about half a mile from Goldstream Creek. More importantly for me, I can find out what the temperature is at work when I’m dressing for riding my bike or skiing.
We ran three Cat5e cables from the computer room, outside and under a footpath, then down the hill from the Main building. The cables end up in a mixed spruce-birch forest, and the sensors will be about six feet off the ground in one of those cylindrical “white plate” style enclosures.
I’m using a pair of DS18B20 temperature sensors, which have a 0.5°C accuracy across their range, and will work down to -67°F. The data is retrieved using the One-Wire protocol, which is well supported by Arduino. I built a prototype of the sensor before soldering it down on a board because longer distances can require a smaller pull-down resistor than the 4.7KΩ typically used between the voltage and data lines. I also wanted to experiment with whether I could run two using parasitic power, or would need two data lines. As it turned out, 4.7KΩ worked, as did parastic power mode.
The schematic is below, including the wires I used in the Cat5e cable. I followed the PoE standard, even though I could really have used whatever wires I wanted.
I also used a contributed library called DallasTemperature which abstracts most of the work of using OneWire and converting the values into meaningful temperatures. Here's the setup code:
#include <OneWire.h>
#include <DallasTemperature.h>

#define ONE_WIRE_BUS 8
#define TEMPERATURE_PRECISION 9

OneWire oneWire(ONE_WIRE_BUS);

DallasTemperature sensors(&oneWire);

// Use a testing program to find your addresses:
DeviceAddress thermOne = {
    0x28, 0xBC, 0x29, 0xE3, 0x02, 0x00, 0x00, 0xE1 };
DeviceAddress thermTwo = {
    0x28, 0xCF, 0x97, 0xE3, 0x02, 0x00, 0x00, 0xCD };

void setup(void) {
    Serial.begin(9600);
    sensors.begin();
    sensors.setResolution(thermOne, TEMPERATURE_PRECISION);
    sensors.setResolution(thermTwo, TEMPERATURE_PRECISION);
}
And the part that does the work:
void printTemperature(DeviceAddress deviceAddress) {
    float tempC = sensors.getTempC(deviceAddress);
    Serial.print(DallasTemperature::toFahrenheit(tempC));
}

void loop(void) {
    sensors.requestTemperatures();
    printTemperature(thermOne);
    Serial.print(",");
    printTemperature(thermTwo);
    Serial.println();

    delay(1000);
}
Here’s the schematic. The top form shows two sensors in parasitic power mode (where you only need a single data line, power and ground), and the bottom form shows how you’d wire a single sensor. If I had trouble with getting reliable data from the sensors in parasitic mode, or with a 4.7KΩ resistor, I would have dropped the resistor to 3.3KΩ or 2.2KΩ. The next thing I would have tried would be running power and ground to both sensors separately (coming from wires 4 and 7 in the cable), and used wire 1 and wire 2 for the data lines to each sensor. As it turned out, I’m only using three of the eight wires in the cable.

Update 2012-10-15: I moved the resistor from the sensor board (you can see it in the photograph at the top of the page) to the Arduino end of the cable inside ABR, and the data is still flowing. I was a little concerned that the resistor might be adding a small amount of heat to the enclosure, and putting it at the Arduino side prevents that possibility.
Update 2012-10-19: Today I added a third DS18B20 in parasitic mode and I’m getting data from all three sensors. I would guess the total cable run is around 100 feet from the Arduino to the sensors. So: 100 feet of Cat 5e, three sensors in parasitic mode, with a 4.7KΩ pull-down resistor between power and data on the Arduino side of the cable.
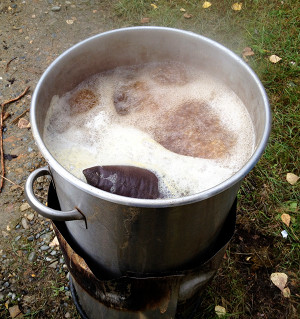
Boil
Over the past month and a half I’ve brewed four beers, starting with Piper’s Irish-American Ale , and culminating with Mr. Silly IPA which is in the middle of the mash right now. We’re less than a week from when we normally get the first snowfall that lasts until spring, so this will likely be the end of my 2012 brewing effort.
My normal process is to make a yeast starter from a Wyeast smack-pack or White Labs tube, pitch that into the first batch, and a week later siphon the chilled wort of the second batch onto the yeast cake from the first.
I didn’t have time to make a starter for Piper’s, so I just smacked the pack (Wyeast 1084, Irish Ale) on brew day and assumed there’d be enough healthy yeast to make quick work of the 1.049 wort. After two days of no visible activity, I began to worry that the yeast in the pack had been killed at some point before I bought it. Finally on day three, something finally started to happen and the beer has since fermented successfully.
The second batch was a 1.077 old ale I poured into my Old Alexi solera ale keg (recipe is here). It kicked off almost immediately and was probably 90% fermented within 24 hours due to the thick, healthy yeast from fermenting Piper’s.
During both fermentations I kept track of the temperatures in the fermentation chamber (a fridge with heater on a temperature controller) and in the wort using my Arduino data logger. A graph of the two fermentations is below:
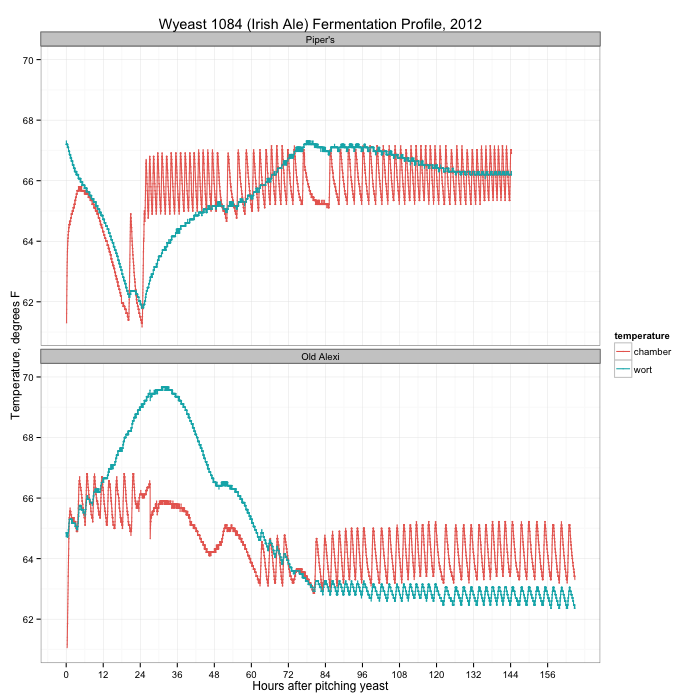
You can see the activity of the temperature controller on the temperature in the chamber (the orange line), clicking the heater on and off within 4 degrees of the set temperature. For Piper’s (the top plot) I started with the chamber at 64°F, but almost immediately bumped it up to 66°F when the wort temperature crashed. After 24 hours, something finally started happening in the wort, with a peak temperature (and fermentation) on day three. When I transferred the wort from primary to secondary on day seven, there was still active fermentation.
Compare this with the second beer. The wort started at 65°F, and immediately took off, peaking a little over 24 hours later. By day three, fermentation was over. I dropped the fermentation chamber temperature from 66°F to 64°F after the first day.
What did I learn? First: always make a yeast starter. It’s no fun waiting several days for fermentation to finally take off, and during that lull the wort is vulnerable to other infections that could damage the flavor. Second: don’t panic, especially with a yeast that has a reputation of starting slowly like Wyeast 1084. It usually works out in the end. More often than not, the Papazian “relax, enjoy a homebrew” mantra really is the way to approach brewing.
I used a starter for last week’s batch (Taiga Dog AK Mild, White Labs WLP007, Dry English Ale) and it was visibly fermenting within a day and a half. Mr. Silly will undoubtedly have a similar fermentation temperature curve like Old Alexi above after I transfer the wort onto the Taiga Dog yeast cake.