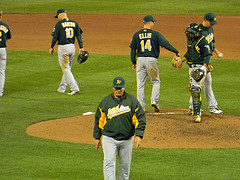
Bob Geren photo from rburtzel
Yesterday A’s closer Brian Fuentes said some unfortunate things about his manager (Bob Geren) in frustration over when he was sent out to pitch in relief yesterday. Here’s what A’s closer (2005—2008) Huston Street had to say about his former manager today:
My least favorite person I have ever encountered in sports from age 6 to 27.
Think about that for a minute. Ever encountered!? To quote my nephew, “Daaaang!” How can the A’s keep Geren around when he’s clearly despised by the players he’s managing?
June 9, 2011, Update: Geren fired! Bob Melvin hired as Interim Manager.
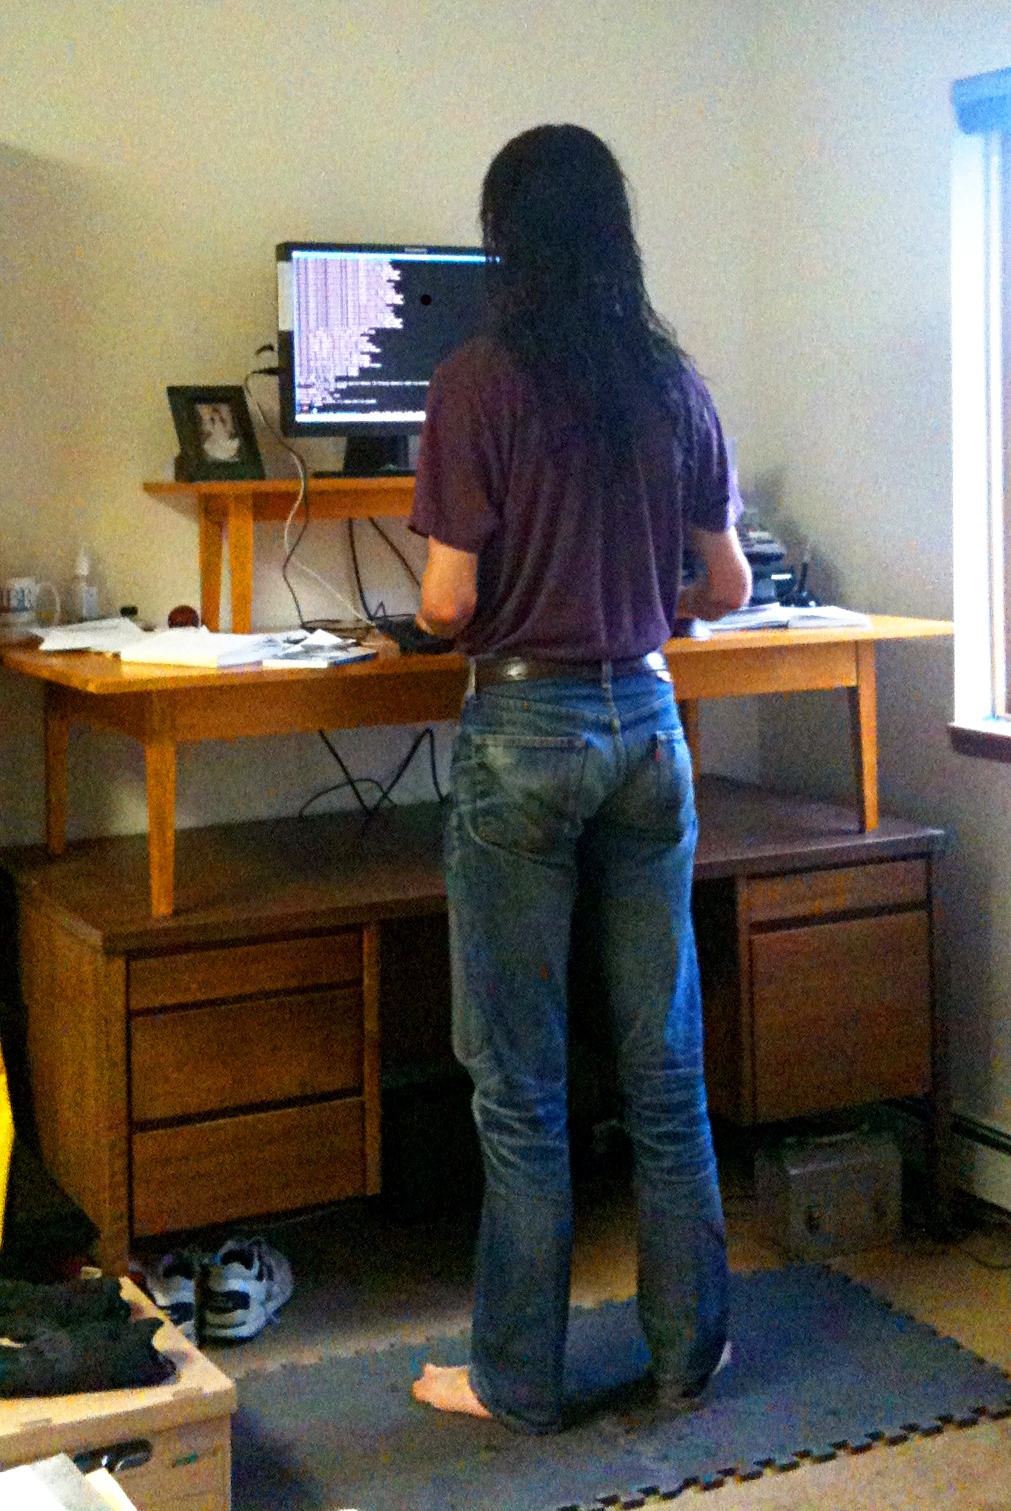
My standing desk, in use
These plans are for a two-level platform that sits on top of an existing desk to bring the height of the main surface to a comfortable standing height. My original desk is 28½” high, and the first platform raises this up 14¼” so the primary surface becomes 42¾” from the ground. This results in my forearms (I’m 6’ 3" tall) resting parallel to the ground when I’m typing at a keyboard. The second platform holds one or more LCD monitors at eye level and sits on top of the first.
The primary surface is ¾” birch plywood, wrapped with a thin strip of wood. This is supported by a frame of 1 x 4” rails and 1½” tapered legs. The rails and legs can be joined with mortise and tenon joints, dowels or pocket screws (I used 5/16” dowel pins, two in each side of the rails). The monitor stand is similar, but with 1 x 2” rails.
My standing desk is finished with several coats of amber and superblonde shellac, then waxed with a good paste wax.
The following is an SVG diagram showing the plans. If you’re having trouble viewing it in your browser (Internet Explorer and older browsers haven’t implemented the SVG standard), this entire post is available as a PDF file (919Kb).
Tools
I used a circular saw with a plywood cutting blade to cut the plywood tops and to rip the trim I used to wrap the edges of the plywood. The legs and rails were cut to length using a Millers Falls Langdon miter box, and I used a Henry Peace rip saw to taper the legs. The tapers were cleaned up with a Stanley #6 corregated sole hand plane. Dowels were located with a self-centering dowel jig and drilled with a power drill. I used Titebond III to glue the legs to the rails, and fastened the tops to the rails using small corner brackets.
Cut List
| Count | Dimensions | Notes |
|---|---|---|
| 1 | ¾” x 30” x 60” birch plywood | Main platform top |
| 1 | ¾” x 12” x 36” birch plywood | Monitor platform top |
| 4 | 1½” x 13½” hemlock, tapered | Main legs |
| 2 | ¾” x 3½” x 49” hemlock | Front and back rails |
| 2 | ¾” x 3½” x 21” hemlocks | Side rails |
| 4 | 1½” x 10” hemlock, tapered | Second platform legs |
| 2 | ¾” x 2” x 27” hemlock | Front and back rails |
| 2 | ¾” x 2” x 5” hemlock | Side rails |
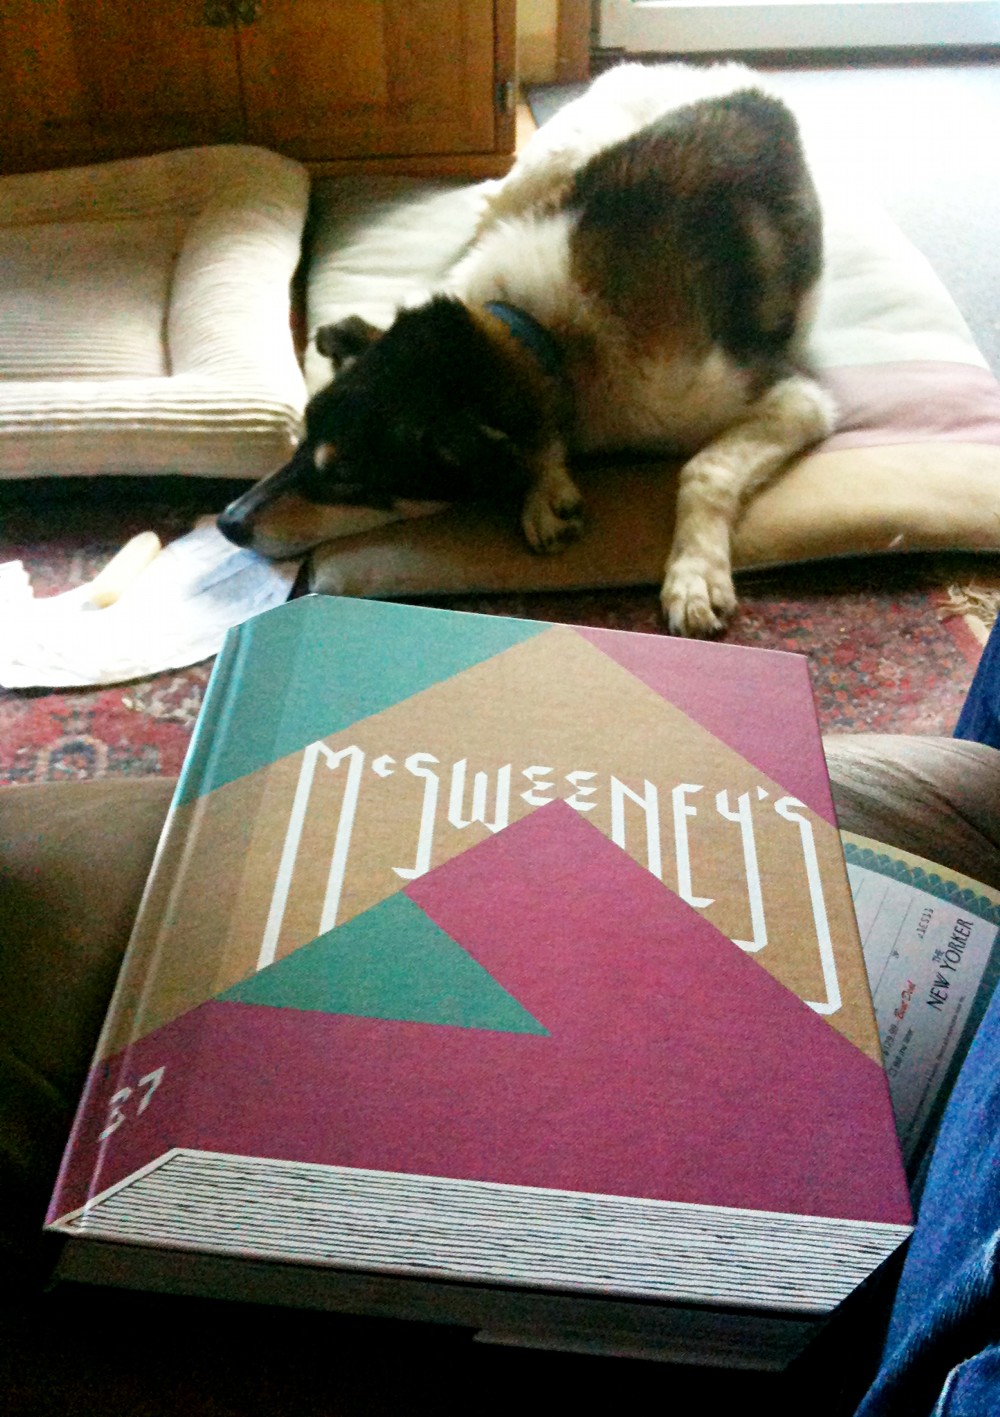
Buddy, McSweeney’s 37
I took some time out from David Foster Wallace’s The Pale King to read the latest McSweeney’s Quarterly Concern, Issue 37, packaged as a hardcover book which has been decorated and trimmed to give the illusion of, yep, a hardcover book. Leave it to McSweeney’s to produce yet another cool, well-produced (sewn binding, actual cloth cover) object containing some great writing.
Favorites in this issue include Jess Walter’s Statistical Abstract for My Hometown, Spokane, Washington, John Hyduk’s great story (essay?) about being unemployed (which has the great image of a warehouse building at night: “It’s dark and raining, but the building glows like a birthday cake”), and Joe Meno’s Lion’s Jaws. I didn’t really get into the five stories from Kenya, but I guess they were interesting from the standpoint of reading within a totally different place and culture.
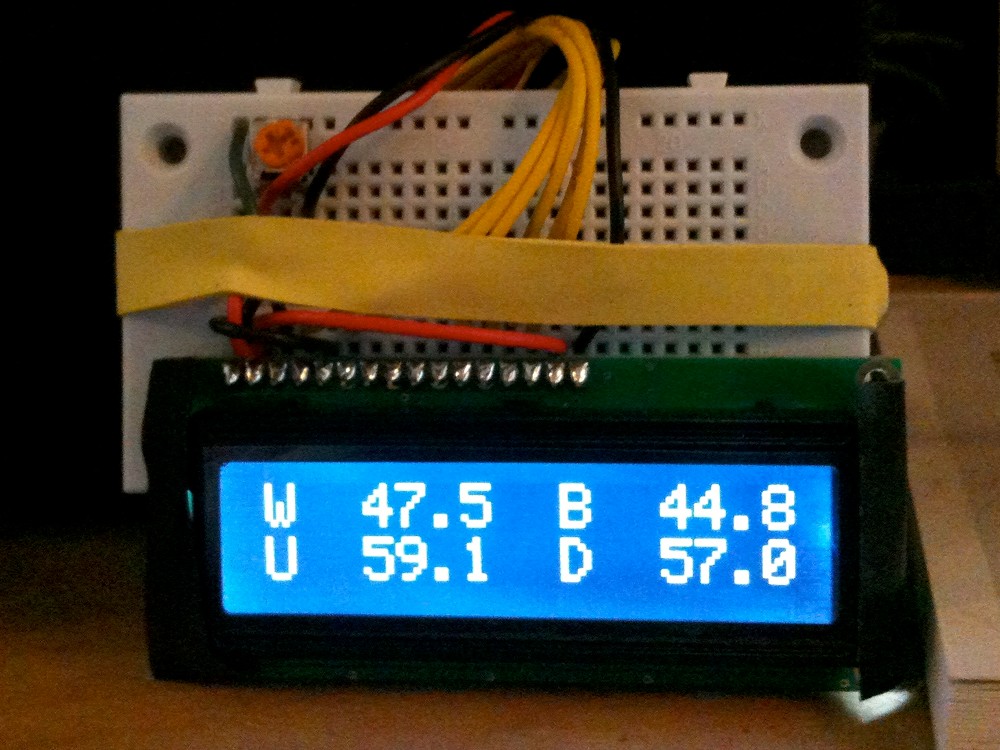
Arduino temperature display
I’ve had an Arduino-based weather station since June 2009, but one problem with it has been that there hasn’t been any easy way to display the data in real time without going to the database (or the raw import files) to see what the latest observations were. I wrote a quick web page for this (home display), and this is convenient if I want to see what the temperatures are around the house when I’m not at home. But sitting in the living room, it’d be nice to know what the temperatures are just by looking.
The choices for displays aren’t all that great. Arduino can drive the classic seven segment LED displays (like old calculators, for those who remember what a calculator is), which are big and bright, but it requires a lot of pins, and even more power to light enough of them to display the amount of data I need (at least four temperatures, and possibly other sensor values like pressure or light). There are graphical LCD panels, which you control pixel by pixel but are expensive and aren’t all that large. And then there are text LCD displays that use the Hitachi HD44780 controller (or one based on it). These are more like old terminal screens where you can write to each character position on the screen. Common sizes are 16 characters across x 2 rows and 20 x 4 displays.
I chose a white on black, 16 x 2 display (SparkFun LCD-00709). It requires 5 volts to power the display and the LED backlight, and uses six of the digital pins on the Arduino board. The Arduino Uno (and earlier Duemilanove) have fourteen digital pins (two of which are the serial TX/RX pins), so one could hook up two of these displays to a single Arduino. The hookup for a single display, and the code I’m using follows. The Arduino Cookbook was invaluable for getting the everything working.
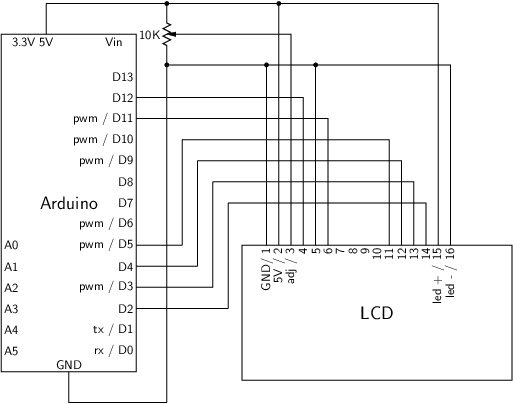
The Arduino code reads four comma-delimited numbers from the serial port. They’re formatted as integer values representing the temperature in Fahrenheit multiplied by ten (50.2°F = 502). If the value is negative, the minus sign appears at the end of the number (-40.0°F = 400-). Here’s the Arduino code that displays the incoming data to the LCD:
#include <LiquidCrystal.h>

const int numRows = 2;
const int numCols = 16;
const int NUMBER_OF_FIELDS = 4; // t_west, t_back, t_up, t_down
int fieldIndex = 0;
int values[NUMBER_OF_FIELDS]; // temp * 10

LiquidCrystal lcd(12, 11, 5, 4, 3, 2);

void setup() {
  lcd.begin(numCols, numRows);
  lcd.print("SWINGLEYDEV.COM");
  Serial.begin(9600);
}

void displayVal(int val) {
  int ival;
  int dval;
  if (val >= 0) {
    ival = floor(val / 10.0);
    dval = val - (ival * 10);
  } else {
    ival = ceil(val / 10.0);
    dval = -1 * (val - (ival * 10));
  }
  if (ival >= 0) {
    lcd.print(" ");
  }
  lcd.print(ival);
  lcd.print(".");
  lcd.print(dval);
}

void loop() {
  if (Serial.available()) { // Read message
    delay(100);
    while (Serial.available()) {
      char ch = Serial.read();
      if (ch >= '0' && ch <= '9') {
        values[fieldIndex] = (values[fieldIndex] * 10) + (ch - '0');
      } else if (ch == ',') {
        if (fieldIndex < NUMBER_OF_FIELDS - 1) {
          fieldIndex++;
        }
      } else if (ch == '-') {
        values[fieldIndex] = values[fieldIndex] * -1;
      } else {
        lcd.clear();
        lcd.setCursor(0, 0);
        lcd.print("W "); // West outdoor sensor
        displayVal(values[0]);
        values[0] = 0;
        lcd.setCursor(9, 0);
        lcd.print("B "); // Back outdoor
        displayVal(values[1]);
        values[1] = 0;
        lcd.setCursor(0, 1);
        lcd.print("U "); // Upstairs
        displayVal(values[2]);
        values[2] = 0;
        lcd.setCursor(9, 1);
        lcd.print("D "); // Downstairs
        displayVal(values[3]);
        values[3] = 0;
        fieldIndex = 0;
      }
    }
  }
}
To make this work, I need a program on the computer the Arduino is plugged into that will read the weather data from the database and dump it to the serial port that the display Arduino is plugged into. Here’s that code:
#! /usr/bin/env python

import serial, time, shutil, os
import psycopg2

connection = psycopg2.connect(host='HOSTNAME', database='DB')
cursor = connection.cursor()
ser = serial.Serial('/dev/ttyACM0', timeout=1)

def make_arduino_str(value):
    integer = int(round(value * 10))
    if value < 0:
        return "{0}-".format(integer * -1)
    else:
        return "{0}".format(integer)

while 1:
    query = "SELECT west, back, down, up FROM arduino_view;"
    params = ()
    cursor.execute(query, params)
    if cursor.rowcount:
        rows = cursor.fetchall()
        for row in rows:
            (west, back, down, up) = row
        (west, back, down, up) = map(make_arduino_str,
                (west, back, down, up))
        message = "{0},{1},{2},{3}\n".format(west, back, up, down)
        ser.write(message)
    time.sleep(60)
ser.close()
cursor.close()
connection.close()
Each minute, it reads the temperatures from a database view that consolidates the latest readings from the weather sensors (arduino_view), formats them in the manner the Arduino display code expects, and sends them to the serial port for display.
It works really well, and looks good. I wish the display itself were larger, however. I’ll probably get a second LCD panel so I can display more data, but if someone would make a 20 x 4 display that was twice as large as the one I’ve got now, I’d buy it. The 16 x 2 is easy to read from the couch (five feet away), but isn’t readable from the kitchen.
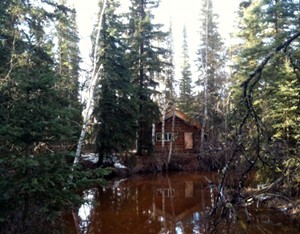
Back cabin, high water
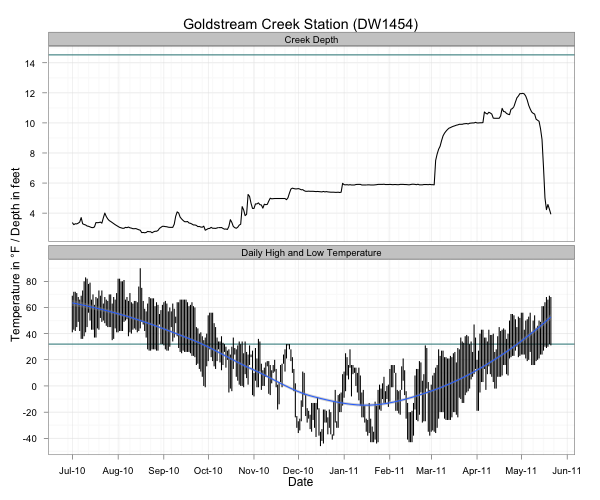
I started measuring the depth of Goldstream Creek a little over a year ago this week. Each morning I measure down from a particular spot on the bridge over the Creek to the top of the water or ice and report this (plus daily high and low temperature, precipitation, snowfall and snow depth) to the Weather Service. The following plot (if nothing shows up, click the following links to view a PNG or PDF version) shows the depth of the Creek at our swimming hole on the top, and the daily high and low temperatures on the bottom. The dark cyan line on the top plot is the height of the bridge (about six feet below the entrance to our house), and the dark cyan line on the lower plot is the freezing point.
At it’s highest, the Creek was just over two feet from the bottom of the bridge, the slough flooded into the dog yard about two thirds of the way across the lowest point, and the Creek seemed dangerously close to topping the banks. The photo at the top shows the back cabin during the high water event.
This year’s breakup was similar to last year: ground and meltwater from the surrounding area started flooding on top of the ice and over the course of a couple weeks, it eroded the ice below until the water level rapidly dropped to more normal summertime depths. One interesting note is that we seem to get a large pulse of water (the rise starting around March 11th) before the snow has started melting, which would seem to indicate that the first pulse is coming from groundwater sources. We don’t start getting afternoon temperatures above freezing until the beginning of April, and this is when snowmelt starts bringing the level up even higher.
When the level begins to drop, it’s pretty dramatic as we go from bankfull conditions to almost nothing in a week. This year we’ve still got wide shelves of ice hanging on the banks six feet above the level of the water.
The plot also shows the brief ice storm in late November where we got a couple inches of rain that froze on the roads and brought the Creek up slightly.
In the past, we’ve had more dramatic breakups where the initial springtime pulse of ground and meltwater breaks up all the ice in a couple days and sends it past our house crashing and grinding, but even the more gradual melting pattern of the last two years is impressive in how quickly the Creek rises and falls.